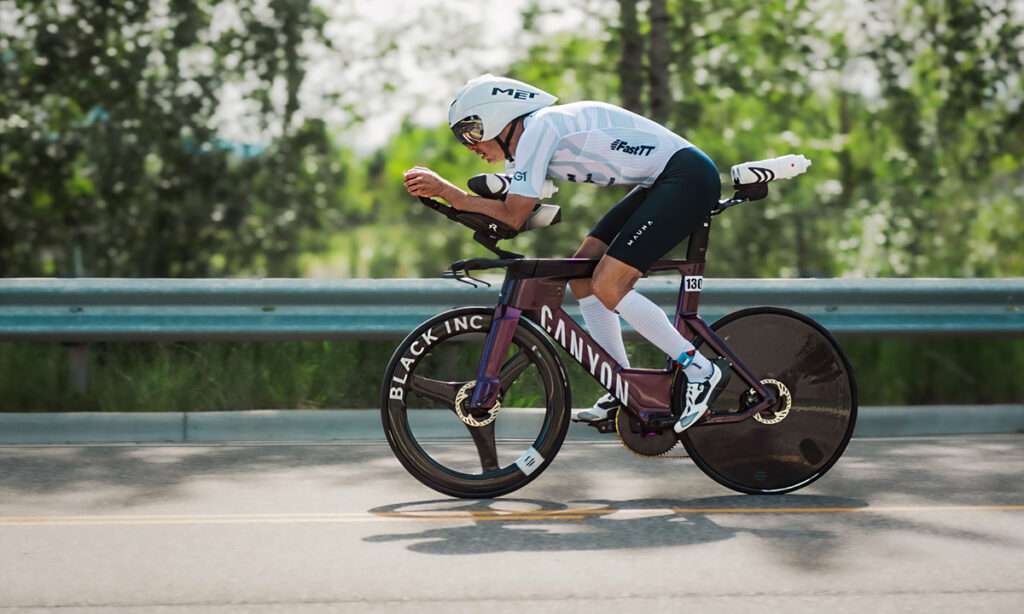
Every triathlete with a power meter eventually asks the same question in transition: how hard can you actually go? Ride too easy and you leave time on the table. Ride too hard and the run turns into a survival shuffle by kilometre three. The gap between those two outcomes usually comes down to one number, and it’s not your FTP itself. It’s the FTP percentage for your triathlon bike leg that you actually hold on race day.
TL;DR
Sprint racers can hold 85 to 95 percent of FTP, Olympic drops to roughly 80 to 88 percent, 70.3 sits around 72 to 82 percent, and full distance usually means 65 to 75 percent, lower again on hot or hilly courses. The number that actually predicts how your run goes isn’t average power, though. It’s normalized power, and that distinction matters more the hillier your course gets.
Key Takeaways
- Your target FTP percentage drops as the race gets longer: high 80s to low 90s for a sprint, down to the mid 60s to mid 70s for full distance.
- Going over that number doesn’t just cost you on the bike. It burns glycogen faster and stacks metabolic fatigue that shows up as a dead run.
- Average power hides how hard a hilly or windy ride actually felt. Normalized power (NP) is the better number to pace by once the course stops being flat.
- Variability index, NP divided by average power, is a quick check on how evenly you rode: aim under 1.05 on flat courses, under 1.08 on hilly ones.
- Heat and hills can pull every one of these numbers down, sometimes by five percent or more.
How much FTP to hold on the bike, by distance
The shorter the bike leg, the bigger the effort it can absorb. As the race gets longer, the FTP percentage for your triathlon bike leg has to come down, because you’re burning through the same glycogen stores you’ll need for the run, sometimes hours later. Here’s roughly where it lands, pulled from a handful of coaching sources and reasonably consistent across them:
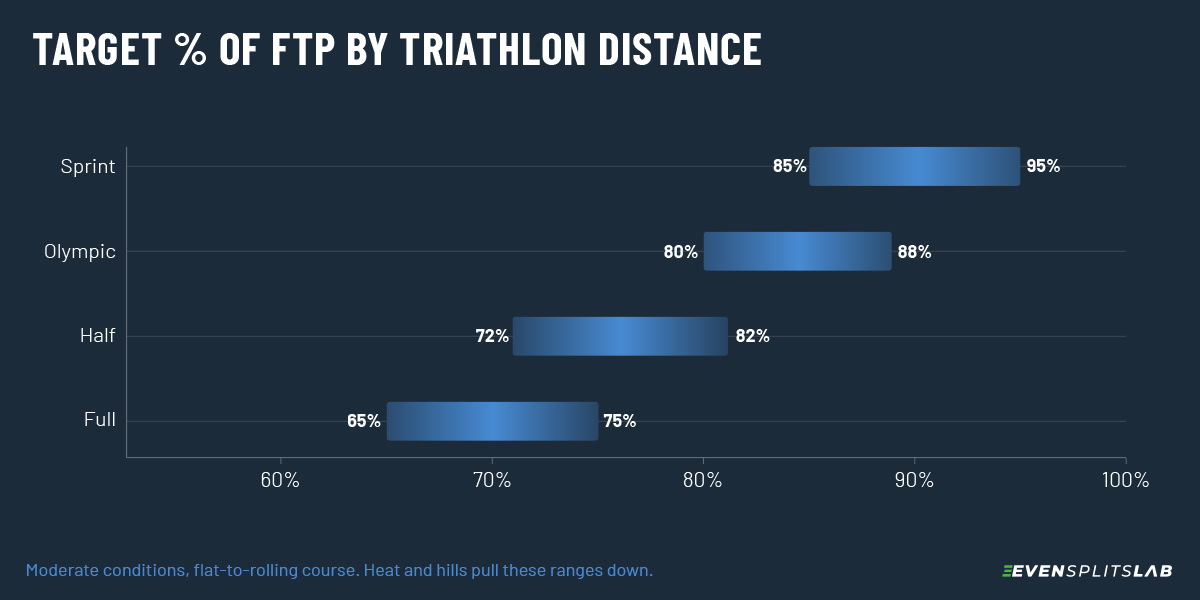
These are starting points, not laws. Course profile, heat, and how much you trust your run fitness all shift the number. If you’re newer to racing, or you’re not sure how your legs hold up off the bike yet, aim for the bottom of the range. Almost nobody loses a race by riding too easy. Plenty of people lose one by riding 10 watts too hard for the first twenty minutes because the legs felt fresh and the adrenaline was doing the pacing instead of the power meter.
If you haven’t nailed down your actual FTP number yet, sort that out before you try to hit any of these percentages.
Why going over that number wrecks your run
People call this bonking on the run, but that’s not quite what’s happening. A true bonk is glycogen depletion: your muscles and liver running out of stored carbohydrate. That’s real, and it deserves its own explanation, covered in The Difference Between Bonking and Cramping. What actually happens when you overcook the bike leg is a bit messier. It starts well before you’re anywhere near empty.
Push past your target power and your body leans harder on anaerobic energy. That’s the fast, oxygen-independent pathway your muscles fall back on when the aerobic system can’t keep up. It works, but it’s expensive. It produces lactate and hydrogen ions faster than your body can clear them. That acid buildup is why a hard effort starts to feel like it’s burning from the inside. At the same time, you’re burning through glycogen at a steeper rate. The anaerobic pathway is just far less fuel-efficient than the aerobic one. Stack enough of that up over an hour or two on the bike. You’re rolling into T2 already carrying a deficit. Your legs might still feel fine in the moment. The bill comes later.
That’s usually where the heavy, disconnected feeling comes from, the thing people call jelly legs or dead legs. Your quads have just spent hours doing repetitive, seated work. Running asks them to do something completely different, under load, while they’re already fatigued. The nervous system driving them is still wired for pedalling, not running. The first kilometre or two off the bike can feel numb or wooden. Your legs might not quite listen to you, even at an easy pace. That’s neuromuscular fatigue talking, not a fitness problem.
Whether that tips into an actual cramp depends on the person and how hard you pushed. Cramping isn’t guaranteed just because you overcooked the bike. But the same neuromuscular fatigue behind dead legs is also the leading driver of exercise-associated cramping. Not sodium, despite what most cramp advice says. The full case for that is in The Difference Between Bonking and Cramping. The harder and longer you ride above your number, the more that risk stacks on top of the heaviness. The run rarely fails all at once. It just gets heavier. The legs stop responding the way they should. By kilometre five you’re negotiating with a pace that felt easy on paper.
Average power vs. normalized power: which one to actually pace by
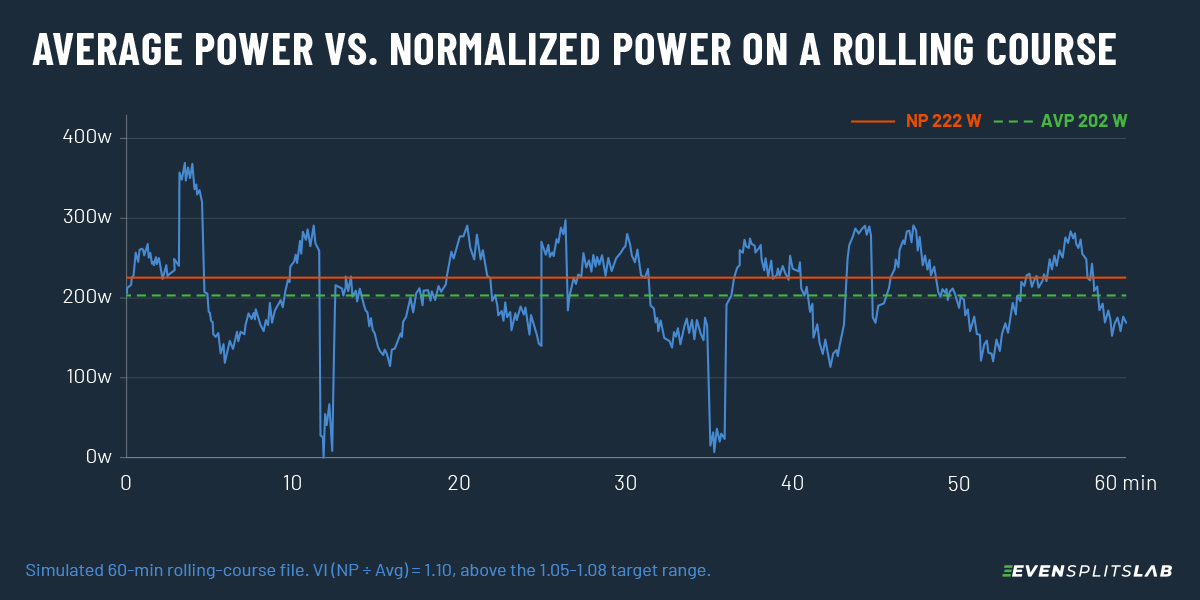
Average power is exactly what it sounds like: total power divided by total time. On a flat, still course, that’s a fine number to chase. The problem shows up the moment the road tilts. Push hard up a climb, coast the descent, and your average can land right where you planned. The climb cost you far more than the coasting gave back.
Normalized power (NP) accounts for that gap. It weights the harder efforts more heavily. That makes it a more honest reflection of what a variable ride actually costs you, not just the average. On a rolling 70.3 or a hilly full-distance course, NP is usually the more honest number. It’s the one worth setting as your actual race target once the terrain stops being flat.
If your bike computer can show a live NP field, use it. If it can’t, a rough workaround is to ride climbs at your target power rather than above it, and let the descents recover on their own instead of pedalling hard to protect your average.
Reading your variability index on race day
Variability index (VI) is NP divided by average power. A VI of 1.00 means you rode dead even. Most coaches look for VI under 1.05 on a flat course and under 1.08 on a hilly one. Above that, you were surging, and surging is what burns the matches you need later on the run.
In practice, that means treating climbs with a bit of restraint. Cap the effort at roughly 10 to 12 percent above target on anything longer than a couple of minutes, and stay on the pedals through descents instead of freewheeling and letting your legs go cold. It’s a small habit on the bike that pays off two hours later.
What moves the number
Heat is the biggest lever. Every range above assumes moderate conditions. Racing in real heat can knock five to ten percent off what you’d otherwise hold, partly because blood flow is being diverted to your skin instead of your working muscles. Pacing and fuelling in the heat gets its own breakdown in Hot Weather Racing: Adjusting Your Nutrition Plan.
Course profile matters too. A pan-flat 70.3 supports a number closer to the top of its range. A lumpy one with real climbing pulls you toward the bottom, and that’s exactly where watching NP instead of average power earns its keep.
Experience plays a role as well. If you’ve never run off the bike at race pace before, the safer move is practising that transition in training rather than finding out your number on race day. A few sessions structured like the ones in Brick Workouts Explained will tell you more about your real limit than any percentage table.
Racing T100? Treat it like a 70.3 for pacing purposes. The bike volume and overall demands land in a similar place, though the format and rules differ. The full comparison is in T100 vs 70.3.
Pacing without a power meter
No power meter, no problem, at least for the shorter stuff. For sprint and Olympic, perceived effort works reasonably well. The bike leg is short enough, and hard enough, that the sensation of effort tracks fairly closely with what you’re actually producing.
That relationship breaks down over 70.3 and full distance. You’re holding an effort for three to six-plus hours. Small differences in intensity don’t feel very different in the moment. Fatigue itself distorts how hard something feels as the hours go by. What reads as comfortably hard at hour one can be a meaningfully bigger physiological cost by hour four. It just doesn’t feel like it changed.
Without a power meter, lean on a pace or heart rate target instead. But validate that number on long training rides first. Treat it as the check, not how you feel in the moment. Heart rate still lags and drifts with heat, so use it as a ceiling, not a target. (More on why HR alone can mislead you in How to Read Your Heart Rate Zones.) A number you’ve actually tested beats trusting feel alone once you’re out past the two-hour mark.
Related Posts
If you’re building your overall pacing discipline rather than just this one race, Zone 2 vs Zone 3 Training breaks down where most of your training time should actually sit.
And if you’re still deciding between distances, Sprint vs Olympic vs Half vs Full: Triathlon Distances Explained lays out how the demands change across the board.
Sources & References
– TrainingPeaks: What is Normalized Power?
– Physiopedia: Lactate Threshold